Carol Zuber-Mallison • ZM Graphics, Inc.
Custom infographics, GIS, cartography, and data visualizations for print, web, and presentation
Adobe Illustrator infographics: vector, scalable, always sharp
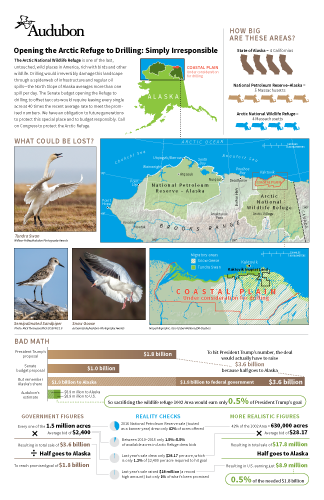
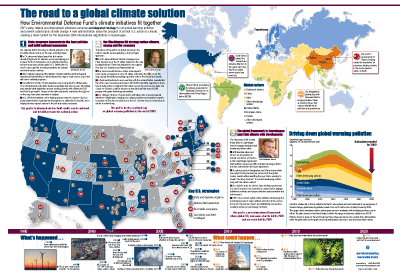
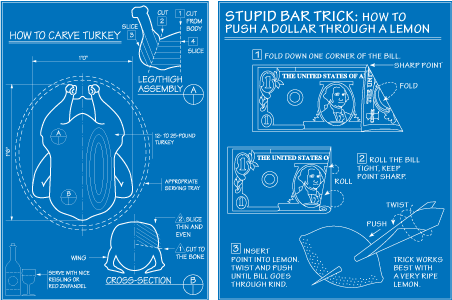
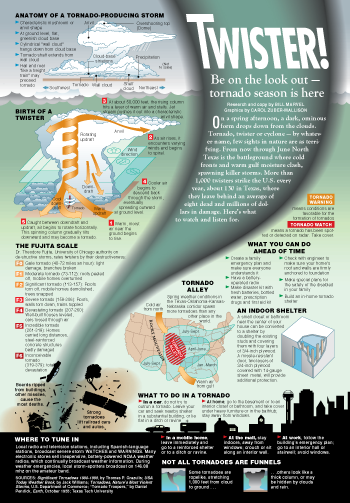
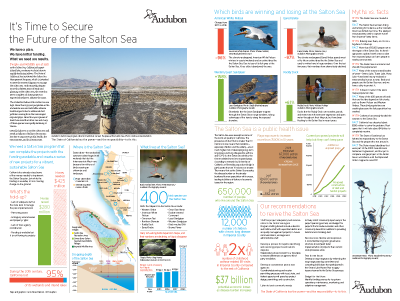
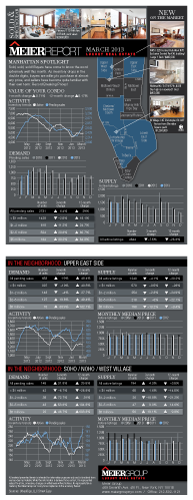
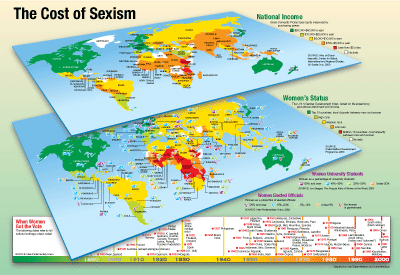
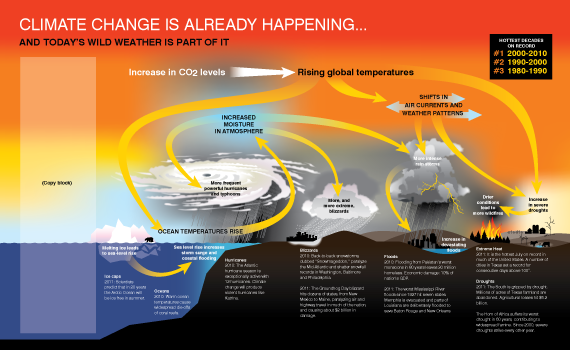
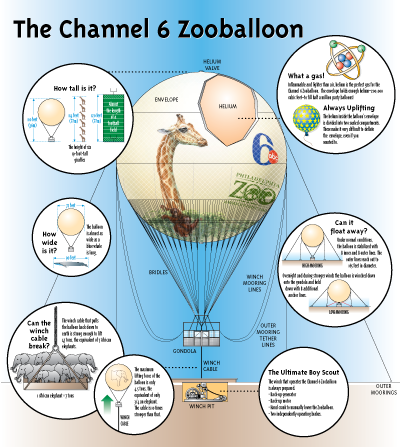
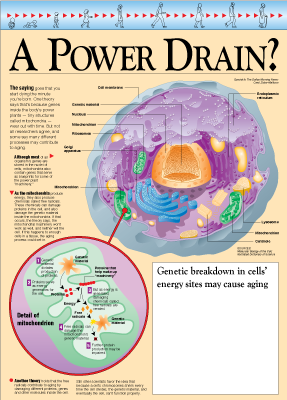
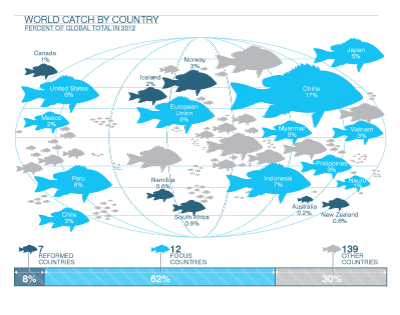
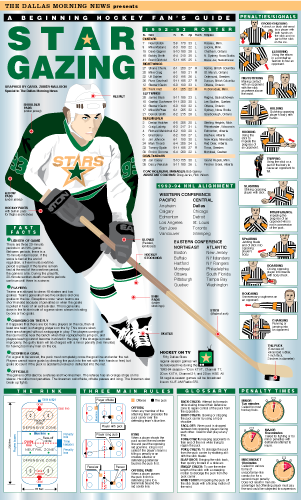
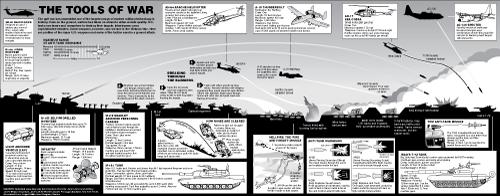
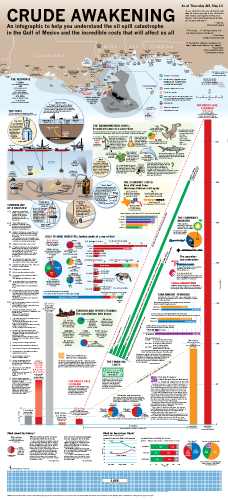
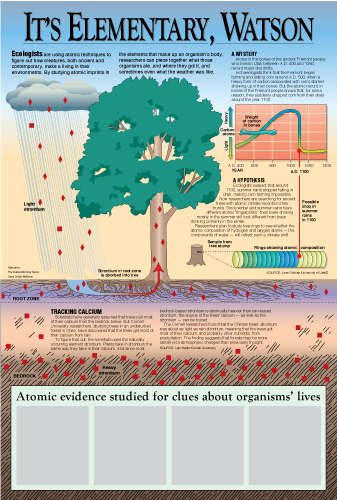
I define an infographic as a collection of charts, maps, and diagrams that gives an easy-to-understand overview of a topic. Sometimes an infographic can be a simple diagram but my favorite kinds of infographics are those
that carefully weave together multiple pieces to explore a single topic.
A list with icons is not an infographic--it's just a list with eye candy instead of bullets. A true infographic attempts to answer the Who, What, Where, When, Why, and How with visuals instead of words.
All my infographics are done in Adobe Illustrator so they are vector, meaning they are built with lines and internal code, not pixels. They can be used at any resolution, are easily scalable, and can be customized for many uses.
Vectors also can be exported for any platform (print, Powerpoint, web, billboards, you name it) and remain sharp. Artwork done in Adobe Photoshop is pixelated and can not be enlarged without becoming a Cezanne painting of fat dots.
I really love doing infographics. If you have a complicated mess of information call me and let me turn it into a visual story.
