Carol Zuber-Mallison • ZM Graphics, Inc.
Custom infographics, GIS, cartography, and data visualizations for print, web, and presentation
I am now on staff at Woolpert Architecture/Engineering/Geospatial as designer/editor on their Strategic Consulting team. I am no longer soliciting freelance clients.

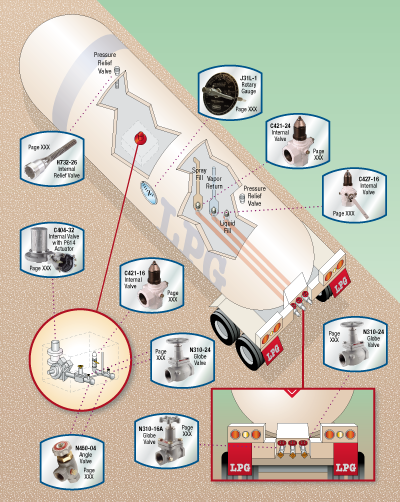
Two-page infographic highlighting bird species affected by Deepwater Horizon oil spill. Client: National Audubon Society magazine. © Carol Zuber-Mallison
PORTFOLIO
Click magnifying glass to see enlargements of all these images • Click chain to go to my portfolio pages
THE LATEST
The Dallas Morning News
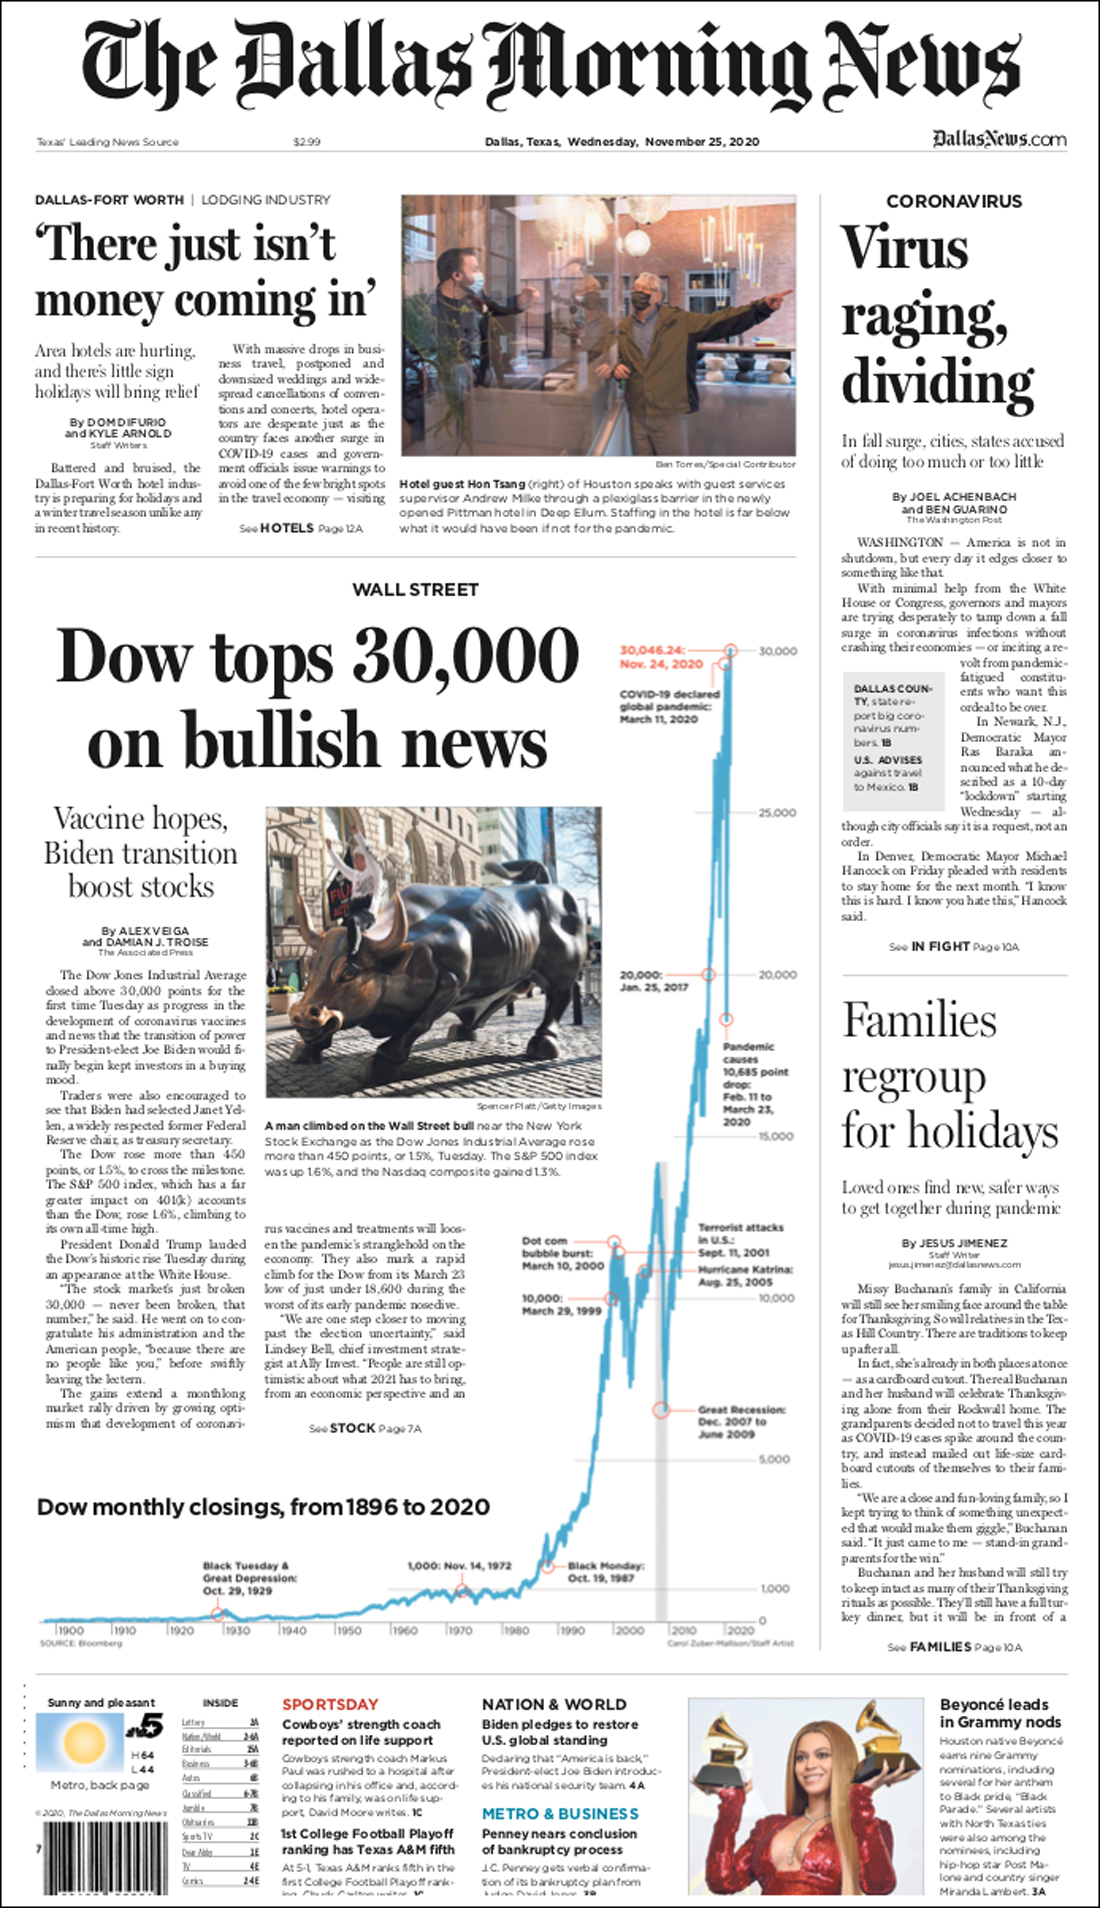
I recently was recruited to work as vacation help for The Dallas Morning News--yes, I'm back to where I worked 30 years ago
and it's still a lot of fun.
I was lucky to be working the night the Dow broke 30,000. Here is the Page 1 graphic I did with news editor Alma Lozoya.
It's great to work with editors who will think outside the box.
Great Salt Lake for Audubon
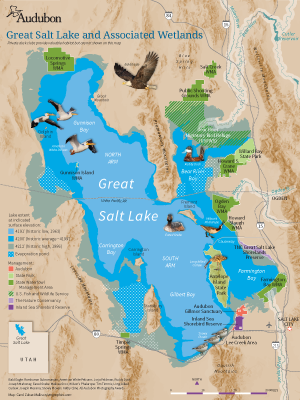
Check out my map of the Great Salt Lake for National Audubon. It combines GIS data, pixel imagery, and vector illustration into one eye-catching and flexible map.
MY BIG BOOKS
Colorado atlas winning awards
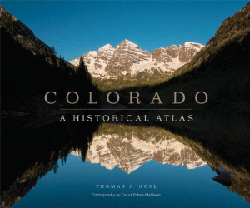
One of my favorite projects, Colorado: A Historical Atlas, has been named best history book by Colorado Humanties and also winner of the High Plains Book Award as best non-fiction. The atlas, published by University of Oklahoma Press, was a labor of love with author Tom Noel. I built more than 100 color maps for the book, some of them requiring topographical backgrounds built from USGS Digital Elevation Model (DEM) data. Here's a map of Colorado ski slopes from the atlas.
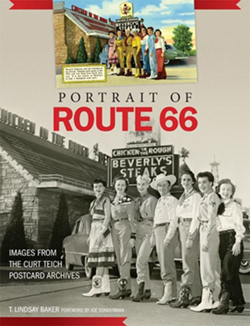
Get your kicks on Route 66
If you get your kicks from history, art, and design, check out Portrait of Route 66 from University of Oklahoma Press. It is a fun tour of images from the Curt Teich Postcard Archives and I got to do a really fun, retro map of Route 66.
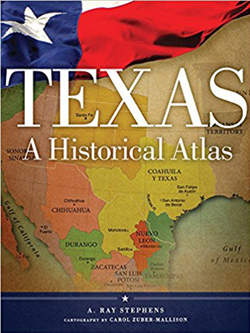
Don't mess with Texas
My first atlas, Texas: A Historical Atlas, is still going strong and was named best reference book by Texas Library Association. The book included 175 maps on everything from the state's history, geography, and current affairs. Here's a map of Texas' geologic regions.
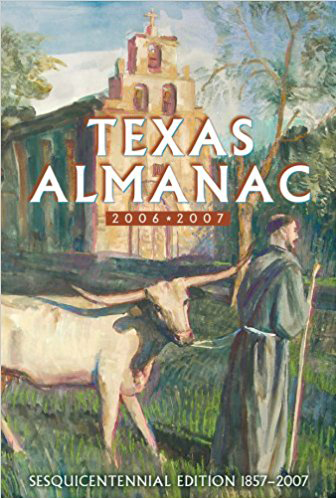
...and if that's not enough about Texas
One of the largest projects I've done was redrawing all the maps for the Texas Almanac — the source for all things Texas. I took the hand-drawn black and white maps, upgraded them to color digital images, and added topographic backgrounds. The project included redrawing 254 counties and 34 subject maps. A couple of my favorite maps from the Texas Almanac.
A SUMMER AT THE SMITHSONIAN
As part of my GIS degree, I was an intern at the Smithsonian Institution in Washington, D.C. One of the best, hardest things I've ever done.
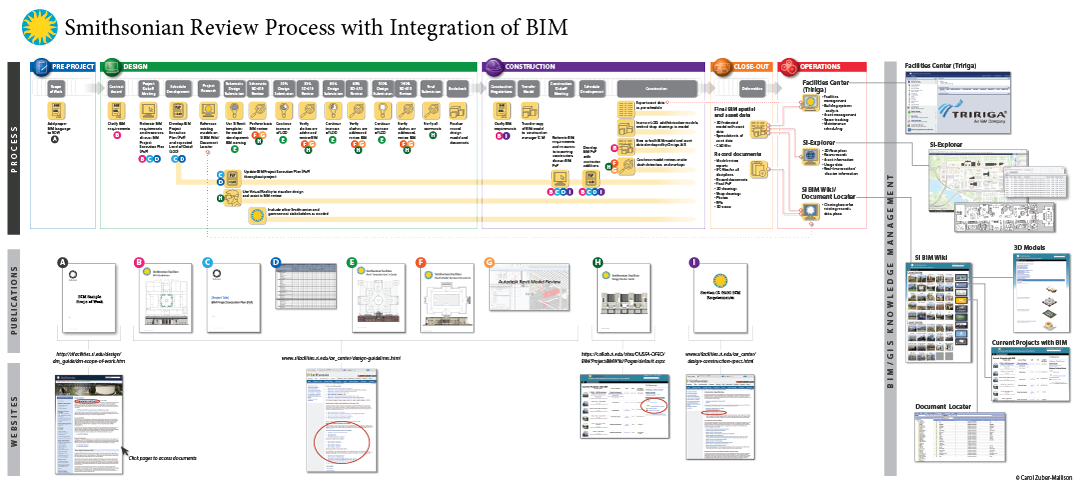
I worked in the Facilities Knowledge Management department of the Office of Business Administration and Technical Services. I studied how SI's new standards for Building Information Modeling (BIM) integrate into their construction and design process and support their GIS databases.
My intern project was to build a BIM training presentation for the design managers who oversee SI's 1,600 existing buildings and the upcoming rehab of the National Air and Space Museum.
My first step was figuring out each step of the BIM process and building it into a poster-sized diagram. Then I built a often humorous, hour-long animated Powerpoint that walked through the process. I also made the diagram into an online pdf with hotlinks that could be emailed to the design managers and link them to the proper BIM reference materials. SI had originally thought they might need to do a thick, dry training manual but I was able to convey all the same information in a single, hot-linked infographics.
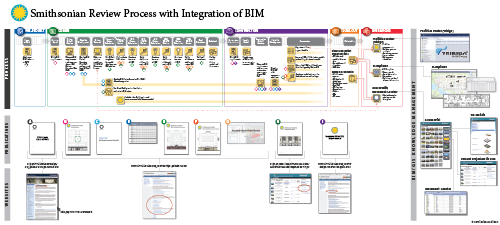
Email me if you would like to see the entire BIM Powerpoint.
WHY USE ME
EXPERIENCE I have four decades in visual communications working for all sizes and types of businesses. I'm strong in taking raw data and figuring the best way to visually tell the story.
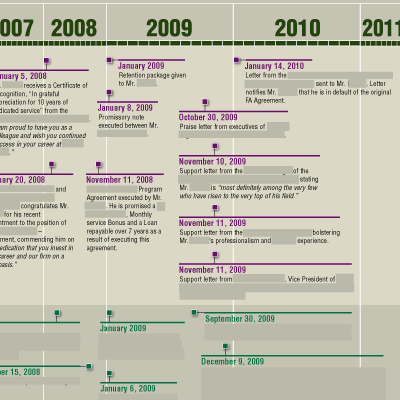
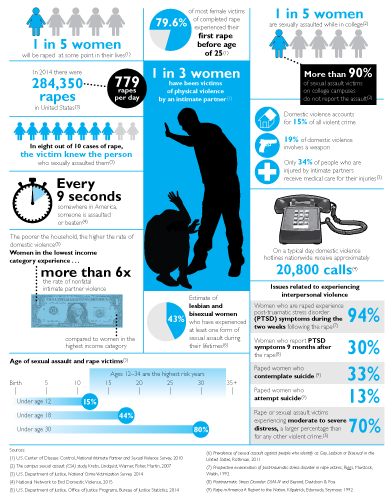
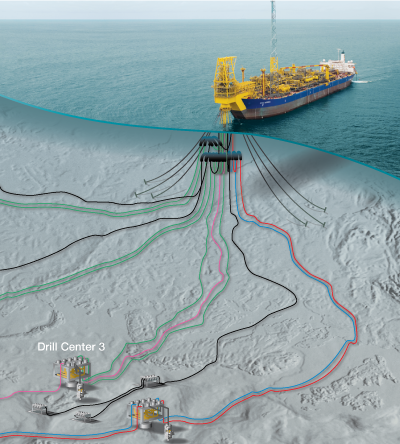
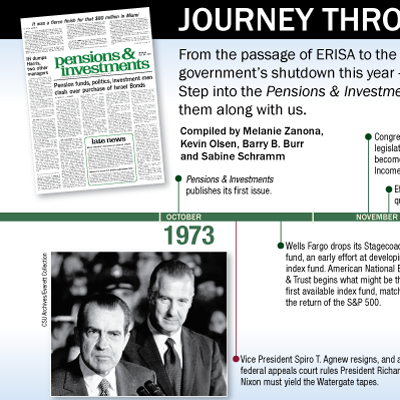
KNOWLEDGE For 25 years I have been a successful freelancer doing infographics on almost every subject: oil/gas, environment, travel, biotech, behavioral sciences, law, anthropology. Bring it on.
JOURNALISM SKILLS I have a reporting/editing degree from the University of Missouri School of Journalism. I emphasize content over design. I bring a lot of research and editing skills so I can often catch your copy errors before your boss does.
TECH SKILLS My main software is Adobe Illustrator but I work in a lot of programs--and now GIS! AI is vector-based so it can output to any size and almost any format.
SPEED I'm "paper trained" from working at major newspapers so I'm faster than most. I'm good at grasping concepts and reducing the drafts needed. However, don't assume I'm available. Contact me first. I juggle a lot of clients.
PERSONALITY I'm not a prima donna. I love working with art directors because it makes my work better. I'm also patient walking newbies through the process. I do graphics, but my goal is "no problems" and to make your life easier.
